
 Abosh
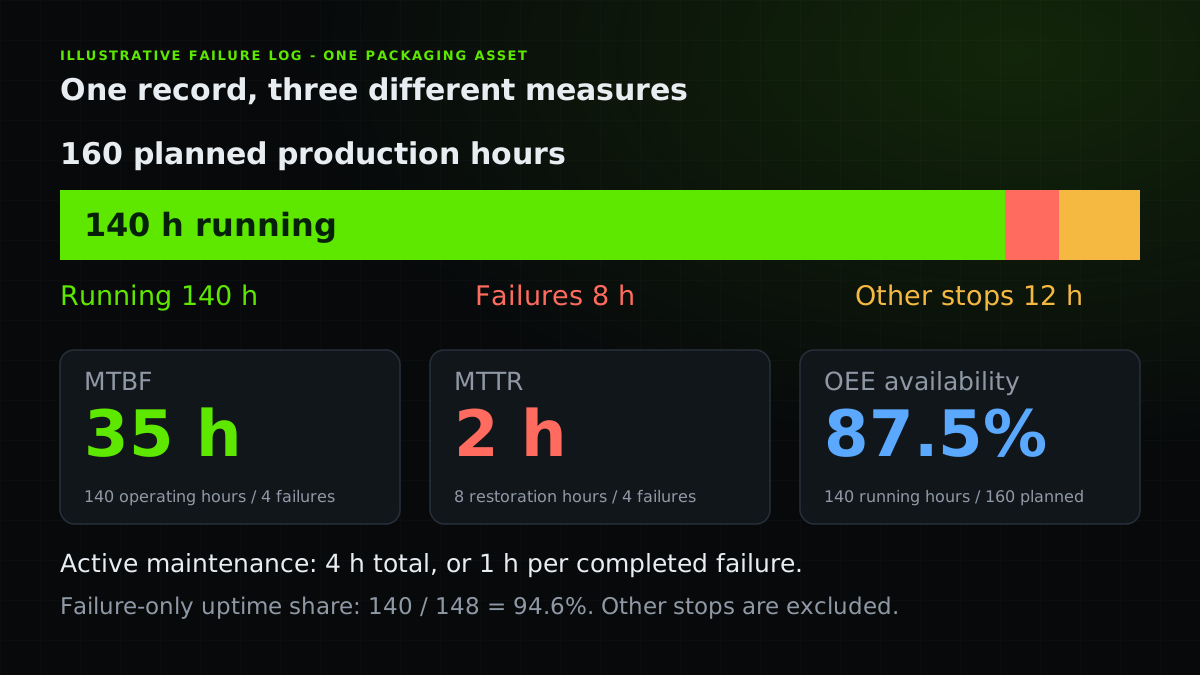
MTBF, mean time between failures, is operating time divided by failure count. MTTR describes average repair or recovery time; this guide measures from equipment failure to return to service and records active maintenance separately. With 140 operating hours, four failures and eight restoration hours, MTBF is 35 hours and MTTR is two hours. OEE availability uses planned production time instead, so it also reflects other recorded stops. Agree on the clocks before comparing equipment.
Calculate both metrics from an operating-hours record and a failure log
Separate time spent on maintenance from the full time to restore service
See why the same failure losses can produce different availability figures
The planned, operating and lost hours behind the example. Make a copy and replace the illustrative values.
CSVWorked failure-event logFour timestamped failures with separately recorded active maintenance time. Use with the operating-hours record.
What MTBF and MTTR tell you
Two teams can both report a two-hour MTTR and be measuring different things. One starts the clock when a technician begins work. The other starts when the machine fails. A long wait for a spare part appears in only one of those reports.
Write the definition beside the number. Here, MTTR means the full time from failure to return to service. Active maintenance covers the measured time spent diagnosing, repairing and checking the equipment; response and other delays remain separate. IEEE’s MTTR overview also describes restoration to service, but your local reporting convention still needs to be explicit.
| Metric | Calculation used here | Question it helps answer |
|---|---|---|
| MTBF | Operating hours ÷ equipment failures | How much running do we get between failures? |
| MTTR | Failure-to-service hours ÷ completed restorations | How long do we take to get the equipment back? |
| Mean active maintenance time | Measured active hours ÷ completed restorations | How much of that time is actual maintenance work? |
Record the operating hours as well as the failures
A failure log cannot tell you how long the machine ran. Keep a separate operating-hours record for the same asset and reporting window, including equipment that had no failures. Use a checked run-time counter or a reconciled production-state history.
Our illustrative packaging asset, PKG-01, has ten scheduled 16-hour production days: 160 planned production hours. It runs for 140 hours, loses eight hours to equipment failures and twelve hours to other stops. The three parts add back to 160. Nights and unscheduled time outside those production periods are excluded.
| Record item | Example value | Why it matters |
|---|---|---|
| Asset and reporting window | PKG-01, September 7-18, 2026 | Match both records to the same equipment and dates |
| Planned production time | 160 h | The OEE availability denominator |
| Operating time | 140 h | The MTBF exposure, checked against the run-time record |
| Failure stop time | 8 h | Four completed failures, with no overlap |
| Other stop time | 12 h | 8 h of changeovers and 4 h of material shortages |
Build a failure log with clear start and end points
Agree on what counts as an equipment failure: loss of the required equipment function. A material shortage or planned changeover can stop production without being an equipment failure. Keep the stop category and the observed symptom separate from a cause that has not yet been confirmed.
For each failure, record an event ID, asset ID, failure timestamp, return-to-service timestamp and measured active maintenance time. Keep time-zone offsets, evidence references and a consistent return-to-service rule. If work pauses for parts, several active intervals may belong to one failure; a single repair-start timestamp will not capture that.
These four illustrative events are fully completed within the same reporting window. Their timestamps are in the downloadable CSV. Other restoration time is the remainder after active work, which may include response, waiting or release delays. The table alone cannot tell us which delay to fix.
| Event | Recorded symptom | Failure to service | Active maintenance | Other restoration time |
|---|---|---|---|---|
| F01 | Drive stopped | 2 h | 1 h | 1 h |
| F02 | Sensor fault | 3 h | 1.5 h | 1.5 h |
| F03 | Mechanical jam | 1 h | 0.5 h | 0.5 h |
| F04 | Sensor fault | 2 h | 1 h | 1 h |
| Total | 4 failures | 8 h | 4 h | 4 h |
Calculate MTBF and MTTR from the two records
NIST’s engineering handbook estimates MTBF from total operating time divided by failure count under its constant-rate model. For our observed record, the calculation is 140 ÷ 4 = 35 hours. Using the 160 planned hours would wrongly include time when the equipment was not operating.
Our defined MTTR is 8 ÷ 4 = 2 hours. Mean active maintenance time is 4 ÷ 4 = 1 hour. Both values are useful: one describes the full recovery, while the other helps isolate the work itself. Report them under different labels.
Illustrative data. The numerator and event count use one asset and one fully observed, matched failure cohort.
Compare frequency and duration together
Now compare a second illustrative asset with the same operating hours and total failure loss, but eight shorter failures. The total lost time looks identical, yet operators experience twice as many interruptions.
Use this pattern to choose what to investigate. Repeated faults may justify a root-cause investigation; long recoveries may justify a closer look at diagnosis, access or delays. Neither average proves the cause or the best remedy. Check individual events and production impact with a downtime Pareto.
| Asset | Operating hours | Failures | Restoration hours | MTBF | MTTR |
|---|---|---|---|---|---|
| PKG-01 | 140 | 4 | 8 | 35 h | 2 h |
| Comparison asset | 140 | 8 | 8 | 17.5 h | 1 h |
Keep OEE availability on its own denominator
Vorne’s OEE explanation defines availability as run time divided by planned production time. It includes recorded changeovers and shortages as well as equipment failures. In this example, OEE availability is 140 ÷ 160 = 87.5%.
If we look only at running and failure-restoration time, the uptime share is 140 ÷ (140 + 8) = 94.6%. The ratio 35 ÷ (35 + 2) gives the same result because these records use the same four fully observed failures. It leaves out the twelve hours of other stops, so it cannot replace OEE availability.
Treat this as a matched example, not a universal availability prediction. Different event cohorts or excluded delays can break the comparison. Availability is also only one OEE factor; speed losses and rejects still matter. See the full OEE calculation.
140 h running + 8 h failures + 12 h other stops = 160 h. The failure-only 94.6% figure uses a different denominator.
Handle zero failures and unfinished repairs honestly
With zero failures, report the observed operating hours and zero events. Do not present zero MTBF or an infinite figure as proof of perfect reliability. NIST provides model-based confidence bounds for that case; a short failure-free window gives limited evidence.
Keep unfinished events open. Do not fill a missing return-to-service timestamp with the report end or silently drop a long ongoing recovery from the story. A completed-event MTTR can look better while the worst failure is still unresolved; show the number and age of open events beside it.
For a stop crossing a reporting boundary, retain the full event and allocate only the overlapping lost time to that window’s OEE calculation. Document the event-count convention for MTBF. A failure-count cohort and a completed-restoration cohort may differ, so do not plug their averages into the simple availability ratio without reconciling them.
Use the numbers to choose the next investigation
Before comparing shifts, machines or months, check product mix, duty, operating modes and the failure definition. Four events are a starting point for an investigation, not a dependable estimate of next month’s losses.
A maintenance improvement matters to production when it reduces a meaningful interruption. Keep origin and downstream impact separate, as in production downtime tracking. A failure on a buffered asset can have a different consequence from one at the line’s current constraint.
Predictive maintenance also benefits from records that distinguish confirmed failures, symptoms and operating exposure. Start by making this week’s numbers reproducible before using them to train a model or justify new spending.
- Agree on the clocks
Define operating time, a qualifying failure, return to service and active maintenance with operations and maintenance.
- Reconcile the records
Check asset IDs, timestamps, overlap and the split of planned production hours. Retain open events.
- Show counts with averages
Report operating hours, failure count, completed recoveries and open recoveries alongside MTBF and MTTR.
- Inspect the pattern
Look at recurring symptoms, long recoveries and recorded delays before choosing a countermeasure.
- Check production impact
Test whether the change reduces relevant losses under comparable conditions, with approved site procedures.
A related example from Abolfazl
Compare the same downtime caused by frequent failures or slow recovery.
In English, on founder Abolfazl’s personal blog. This is related reading, not an independent technical source.
Practical checklist
- Write down the required equipment function and what qualifies as a failure.
- Match operating-hours and event records to one asset and reporting window.
- State whether MTTR covers full restoration or a narrower repair interval.
- Measure active maintenance separately from response and waiting time.
- Use timestamps with explicit time-zone offsets and traceable evidence.
- Remove duplicated events and resolve overlapping stop records.
- Report zero-failure exposure and open events without invented durations.
- Separate equipment failures from changeovers and other production stops.
- Show event counts and the spread of durations alongside averages.
- Verify production impact before claiming an improvement.
FAQ
FAQ
Sources and further reading
Authoritative references used to research and verify this guide.