

Field guide
Forecast review
Check whether each forecast review improves the forecast
Keep the issued versions. Compare the same demand. Find which review deserves a closer look.

Vrolen blog
Practical guides to investigating losses, testing changes and deciding what to improve next.
Forecast review
Keep the issued versions. Compare the same demand. Find which review deserves a closer look.
Material planning
Define the buffer, the demand it counts and the order it permits before comparing the results.
Product and process quality
One part revision. Named owners. Evidence that matches the process actually used.
Improvement project priorities
Write down what waiting changes. Then check whether the team can actually finish the work.
Factory data agreements
Keep the raw event. State the consumer's assumptions. Test what happens when a producer changes them.
Process observation
Follow one job with the people doing it, without turning the walk into an inspection tour.
Equipment care
A machine can be repaired five times while the recurring problem remains open.
Inventory decisions
A percentage buffer is a planning choice, not proof that the next delivery is protected.

Order variability
The customer buys a little more. The order sent upstream changes a lot.
Supplier evidence
A single score cannot explain whether the problem was timing, quantity or acceptance.
Demand and supply
Agree what the operation can promise before the schedule becomes a daily argument.
Material planning
The brackets can arrive on Thursday while the shared machine is still unavailable.

Project scheduling
Two tasks can run in parallel on paper and still need the same person.
Understand the work
A useful map starts with a clear boundary and people who can show what really happens.
Mistake-proofing
A device that accepts the correct part has passed only the easiest test.
Automation choices
Automating a duplicate request makes the duplicate arrive faster.
Operational change
Follow one request from a paper record to a different way of working.
Supply chain flow
Follow one order clock across supplier, production, approval and receipt.

Project flow
A busy reviewer, missing inputs and a slow decision need different fixes.
Simulation basics
Three jobs and one reviewer are enough to understand how an event model works.
Quality costs
Follow the cost of a defect without counting the same loss twice.
Capacity planning
Check the hours behind the promise before sequencing the jobs.
Complaint response
Protect the customer now, then prove what needs to change.
Maintenance planning
A long work list tells you little until hours and readiness are visible.
Process control
Write what happens when a check fails, not only what gets measured.
Process experiments
The effect of one setting can depend on the other setting.
Inspection decisions
A shared pass-fail label needs more than a training attendance sheet.
Shift coverage
Four trained names can still leave one station uncovered.
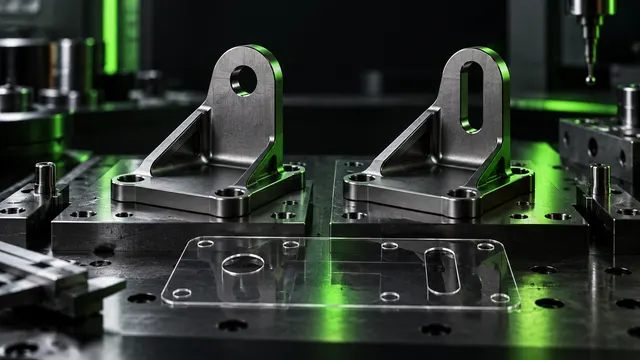
Product revisions
Approving the drawing leaves several production decisions unfinished.
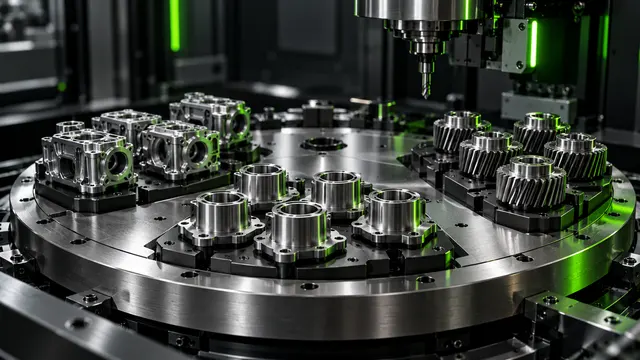
Production repetition
A smaller batch needs room for its next changeover.
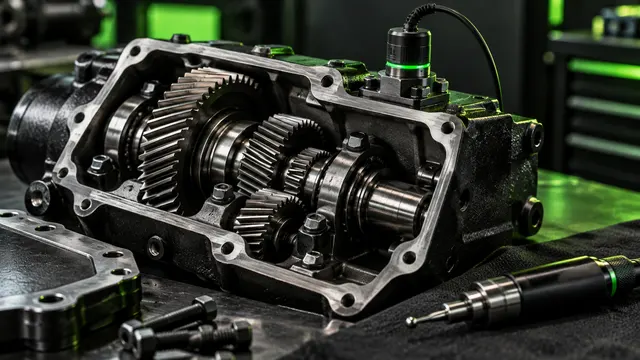
Maintenance decisions
Start with what can fail and what the failure would mean.
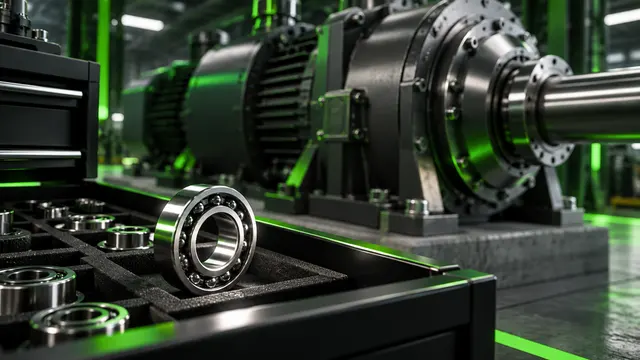
Maintenance inventory
A low-price part can carry a high consequence when it is missing.
Reliability data
An average lifetime cannot show how risk changes with age.
Work release
A free slot and a customer need are two different release checks.
Plant energy
Less leaking air helps. The electrical result still needs a meter.
Factory data quality
A smaller counter value needs an explanation before it becomes output.
Event records
The first message received may describe the later machine event.
Inspection thresholds
The accuracy percentage cannot choose the reject setting for you.
Model evaluation
The model must answer with information the line actually has at that moment.
Model monitoring
A changed input distribution deserves investigation, not automatic retraining.

Lot acceptance
A clean sample can come from a defective lot. Check the odds.
Work design
Draw the overlap before adding operator and machine times.
Manufacturing data
Follow one suspect lot without counting its history twice.
Quality risk
A reversed connector, a keyed fixture and an action that stays open until the test is done. Make the risk review useful after the meeting.
Pull replenishment
Eighteen cards can authorize 360 units. Before adding another card, find out which part of the replenishment loop needs it.
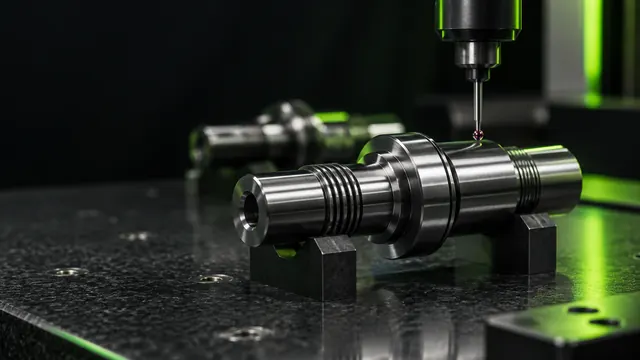
Process capability
The spread can stay the same while Cpk falls from 1.33 to 0.80. A shifted process needs a different response from a noisy one.
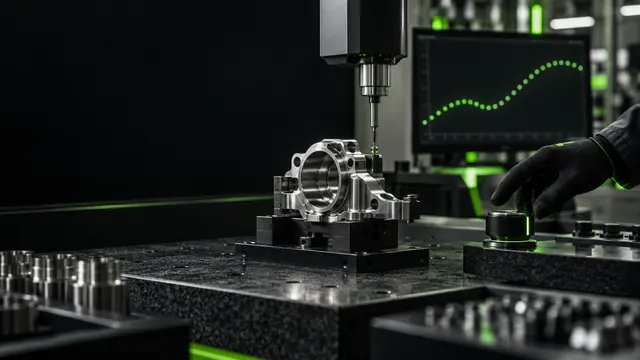
Statistical process control
A batch with more rejects deserves context before an adjustment. A control chart gives the investigation a stated rule.
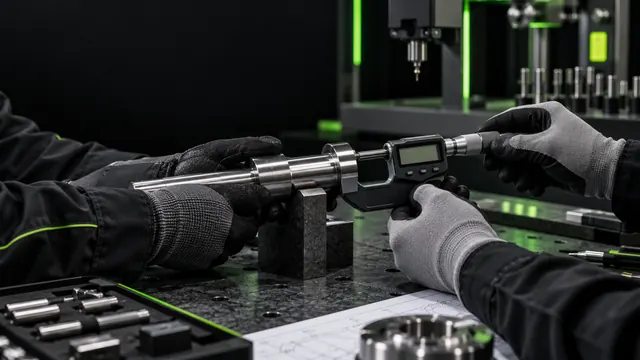
Measurement system analysis
A measurement can look precise on screen and still change with the operator. Check the measuring process before judging the production process.
Delivery reliability
Count the orders that meet both delivery conditions. The worked example shows why 80% on time and 90% in full do not establish 72% OTIF.
Multi-stage quality
Three stages at 90% first-pass yield leave 72.9% of the starting units passing every stage without rework.
Production leveling
A repeating AABC sequence can match a 2:1:1 product mix. It only works if the line can actually replenish that mix at the planned interval.
Manufacturing data integration
A delivered message can still contain the wrong unit, an old value or a duplicate event. Reliable analytics needs the meaning as well as the connection.
Simulation credibility
A model can match weekly output and still miss the daily pattern. Decide what evidence would make its recommendation credible before tuning it.
Manufacturing energy performance
Electricity can fall 5% while energy per accepted unit rises nearly 7%. The denominator changes the conclusion.
Downtime cost
One hour stopped can cost €350, €530 or €1,150 in this worked example. The difference is what happens to the missing production.
WIP and lead time
240 units in progress at 80 units per working hour imply three working hours of average lead time. Check the time basis, process boundary and unfinished orders before using the result.
First-pass yield
970 of 1,000 parts can eventually pass while only 900 pass first time. A clear unit ledger shows the work hidden between those two results.
OEE formula
Calculate OEE from Availability × Performance × Quality with a worked example, then map the score to the six big losses.
Takt vs cycle vs lead time
Formulas, one worked production example, and the mistakes that lead to bad capacity decisions.
Agentic AI
What an AI agent is in a plant, three good first use cases, an autonomy ladder and the guardrails that keep it bounded.
Downtime Pareto analysis
Rank the same downtime events by lost minutes and event count. Compare the reasons and operating conditions before choosing which stop to investigate.
OEE vs throughput
Seven reasons a better OEE score can leave shipments, lead time and delivery unchanged.
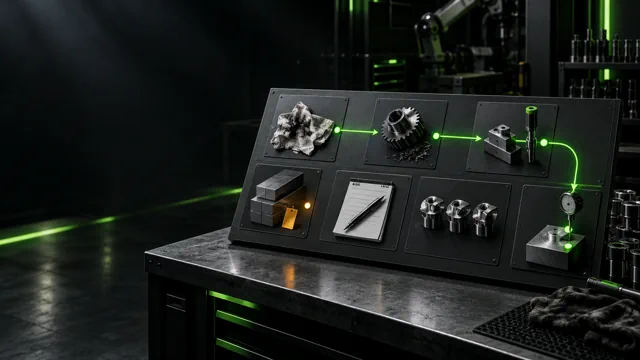
A3 problem solving
Follow seven A3 sections through a worked problem. Use the worksheet to keep observations, cause tests and follow-up checks together.
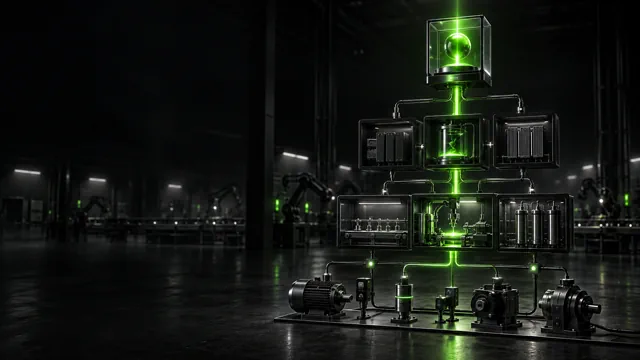
Manufacturing KPI tree
A four-level hierarchy that connects business outcomes to the drivers you can actually act on.
Line balancing
A worked example of takt, work content and operator loads, and why the arithmetic minimum is often not achievable.

AI root cause analysis
Check AI-ranked causes against the records, competing explanations and a suitable test. Review four failure paths that can mislead an investigation.
AI for continuous improvement
A seven-step example of where AI may help, what to check and which decisions stay with people.
OEE vs TEEP vs utilization
Use a one-day example to see which time each metric includes and which question it answers.
Dynamic bottlenecks
Compare event records by product and shift. Check which station limited output when the mix, changeovers or downtime changed.
MTBF vs MTTR vs OEE
Four failures, two time records and a calculation you can check. Learn why the hours behind the average matter as much as the number.
Digital twin vs simulation vs process mining
A comparison by question and evidence, and a rule for choosing the smallest model that can change the decision.
Manufacturing analytics software
Use sixteen criteria in four groups to compare six software categories. Plan a trial with your own records, clear ownership and an export check.

MES vs OEE vs analytics
A need-to-layer matrix and a four-layer model: record, execution, analysis and improvement.
RCA software
Compare five categories of RCA software. Check whether each tool keeps the observed problem, possible causes, test results and follow-up connected.

Continuous improvement in manufacturing
A practical system for finding, testing, verifying, and sustaining manufacturing improvements with evidence.

Lean manufacturing
Understand lean principles, flow, pull, standard work, problem solving, and the conditions required for lasting results.

Operational excellence in manufacturing
Agree what the customer needs, who handles a problem and how the team checks whether a change lasts across shifts.

Continuous improvement software
Evaluate CI software for evidence capture, prioritization, experiments, governance, integrations, security, and adoption.

Manufacturing software guide
Use ISA-95 boundaries and real operating decisions to design a manufacturing software architecture without duplicate systems.

The eight wastes of lean manufacturing
Spot defects, waiting, extra movement and the other wastes on a real process walk. Record what you see before deciding what to change.

Lean manufacturing vs Six Sigma
Compare goals, methods, data needs, strengths, and failure modes before selecting an improvement approach.

Continuous improvement project portfolio
Select, sequence, stop, and verify Kaizen and capital projects using system impact, evidence, capacity, risk, and learning.

Operational excellence metrics
Define the safety, quality, delivery and cost results the team must track. Link each measure to a named response and the records behind it.

Real-time production monitoring
A machine state needs a timestamp and context. Decide who responds, how soon and what happens when the data stop arriving.

Value-stream mapping
Map the flow, add assumptions, and test changes before rollout.

Root-cause analysis
Follow a recurring packaging fault from the first observation to a testable cause, then use the worksheet for your own investigation.

OEE loss analysis
Connect availability, performance, and quality loss to total flow.

Digital twin in manufacturing
Connect live operating data to a validated model, test scenarios, and turn results into controlled improvements.

Predictive maintenance
Use sensors, maintenance history, AI, and simulation to detect degradation and choose the right intervention window.

5S methodology
Use sort, set in order, shine, standardize, and sustain to expose abnormal conditions and protect flow.

Kaizen event
Frame the problem, observe the real process, test countermeasures, and sustain the result after the workshop.

Lean Six Sigma
Separate flow and waste problems from variation and defect problems, then use evidence to select the right method.

PDCA cycle
Define a prediction, test a controlled change, study the result, and standardize only what the evidence supports.

SMED changeover reduction
Separate internal and external setup, simplify adjustments, and verify quality, safety, and total-system flow.

Theory of Constraints
Identify, exploit, subordinate, elevate, and repeat while measuring throughput, inventory, and operating impact.

Manufacturing bottleneck analysis
Combine cycle time, queues, blocking, starvation, product mix, and simulation instead of relying on utilization alone.

Process mining in manufacturing
Reconstruct process variants from timestamps, compare conformance, and connect discovered delays to physical operations.

Industrial AI in manufacturing
Connect production data, domain knowledge, machine learning, and simulation with clear confidence and human control.

Industrial IoT and smart manufacturing
Record the asset, unit, timestamp and quality of each IIoT signal. Plan secure collection and a response when data stops arriving.

Manufacturing data analytics
Build trustworthy manufacturing analytics from PLC, sensor, MES, ERP, quality, maintenance, and manual data, then connect every insight to an operating decision.

Production downtime tracking
Record what stopped, when it restarted and what is actually known. Then check how a reporting threshold changes the loss categories.

Production scheduling optimization
Combine orders, constraints, changeovers, labor, material, downtime, and uncertainty to test schedules before releasing them to the floor.

Predictive quality in manufacturing
Connect process conditions, product context, inspection results, and machine learning to intervene before defects become scrap or customer escapes.

Andon system in manufacturing
Define who answers an Andon call, how quickly they must respond and what they record. Use recurring calls to select the next investigation.
Private pilot