
 Abosh
A planner calculates forecast value added by comparing a forecast's performance before and after a defined review stage. Keep the products, actual demand, issue date, forecast horizon and error measure consistent. With an error measure, subtract the later stage's error from the reference error: a positive result means lower error. Preserve a simple forecasting baseline too, then inspect repeated results before changing the process.
Separate a useful override from a changed comparison.
Keep the forecast version that existed when the decision was made.
See how the chosen error measure can change the conclusion.
Define the stage before scoring it
The planner saves the statistical forecast before an analyst changes it. The analyst then records the revised forecast and the reason for the change. When actual demand becomes available, the team can compare both versions on the same observations.
SAS's forecast value-added guide and the Institute of Business Forecasting describe this comparison between process stages. A team can examine an analyst override, a consensus review or another recorded step. It must keep the inputs to the comparison consistent.
Keep two comparisons separate. The incremental comparison checks a stage against its immediate predecessor. The baseline comparison checks the process against a simple method, such as a suitable naive or seasonal-naive forecast. A review can improve a weak model while the complete process still trails that baseline.
State the sign and the unit
For an error measure where lower is better, calculate reference error minus candidate error. A positive difference favors the candidate on that measure. State which reference you used; a number labelled FVA without its comparison is incomplete.
When both errors are percentages, their difference is in percentage points. A planner should not report that difference as a percentage reduction in inventory or as cash saved. Forecast error and the consequence of the resulting order need separate records.
Use the same measure, observations and horizon. Positive means lower error; negative means higher error. Percentage errors produce a difference in percentage points.
How the error measure changes the forecast comparison
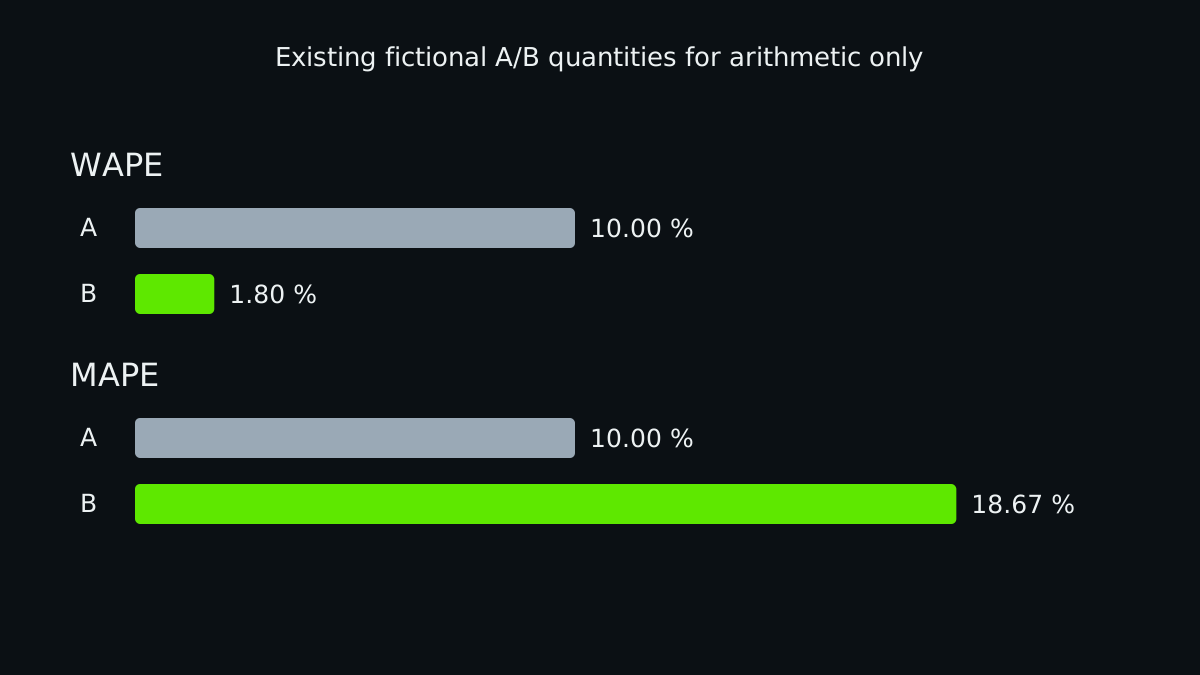
Compare the two forecasts for three fictional products from Abosh’s forecast-accuracy note. Both use the same actual demand. The example has no historical issue times or sequence of overrides, so it can show how the metric changes the comparison but cannot measure the effect of a review meeting.
Treat A as the reference and B as the candidate for this calculation only. Actual demand totals 1110 parts. A misses 111 parts in absolute terms; B misses 20. Both forecasts run below actual demand on every row.
| Existing teaching row | Actual parts | Forecast A | Forecast B |
|---|---|---|---|
| High-volume part | 1000 | 900 | 990 |
| Medium-volume part | 100 | 90 | 95 |
| Low-volume part | 10 | 9 | 5 |
The original A/B calculation from Abosh
Inspect the same three-product quantities, error formulas and timing limits used here.
Read the forecast-accuracy note
In English, on founder Abosh's personal blog. This is the source of the labelled teaching example, not independent evidence of a forecasting improvement.
Keep dates and missing records in the comparison
A buyer choosing an order eight weeks before delivery cannot use a forecast issued two days before delivery to explain that earlier choice. The existing forecast-accuracy note uses this timing distinction. Preserve the issue time, target period and horizon of every stage you intend to evaluate.
Match the records by product and target period. If a version is missing, report the unmatched population and its reason. Dropping difficult rows from one stage can make its score look better without improving any forecast.
Agree what actual demand means. Sales during a stockout may omit demand that could not be fulfilled. Label a sales-only comparison honestly and retain the shortage evidence. A planner should also keep zero-demand rows: MAPE is undefined for a row with zero actual demand, and WAPE is undefined when its entire denominator is zero.
Read the score with the decisions it supports
The three-product comparison shows a choice between total unit error and relative product error. It cannot identify which shortage would stop a customer's operation. Keep important individual misses and directional bias beside the aggregate result.
Hyndman's discussion of WAPE also warns about its changing denominator and its use across non-stationary series. Do not infer improvement from a falling percentage across different demand periods. Compare matched stages on the same records, and choose a suitable baseline or scaled measure for longer-run method evaluation.
A negative result gives the team a specific review to investigate. Check whether a promotion, data correction, late input or another changed condition explains the result. Avoid ranking people from one product or one period. The score describes the recorded comparison; it does not prove a person's judgment caused the outcome.
Run a review the team can reproduce
Use the comparison record with the original versions still attached. Leave missing dates, reasons and costs empty until someone can supply them. The included A/B data supports arithmetic checks only; it is separate from the blank process-evaluation record.
- Name the decision and horizon
Choose the order or planning decision whose forecast you need to evaluate.
- Save the stage outputs
Retain issue time, product, period, units and version before anyone changes the forecast.
- Match the evaluation records
Use the same actuals and report missing, excluded and stockout-affected observations.
- Calculate both comparisons
Compare each stage with its predecessor and the complete process with a suitable simple baseline.
- Investigate and check again
Review important misses and repeated results before keeping, changing or removing the step.
Practical checklist
- Name the forecasting stage and its immediate reference.
- Keep a suitable simple-method baseline separately.
- Preserve issue time and forecast horizon.
- Match products, periods, units and actuals.
- Retain unmatched and stockout-affected records.
- Declare the error measure, sign and rounding.
- Inspect bias and important individual misses.
- Record the next process change and how the team will check it.
FAQ
FAQ
Sources and further reading
Authoritative references used to research and verify this guide.