

 Abosh
Safety stock protects a defined replenishment process against uncertainty. A reorder point tells you when to trigger replacement, while an order quantity tells you how much to request. For a simple continuous-review rule, the trigger covers expected demand during replenishment plus the chosen safety stock. Use a defined inventory position and check actual lead-time demand, service requirements and supply constraints. There is no universal 50% allowance or good stock level that fits every part.
Separate the replenishment trigger from the quantity ordered.
Check a chosen buffer against a transparent demand record.
Keep service, shortages and inventory costs visible when changing the rule.
Four inventory terms answer different questions
Cycle stock comes from the normal order-and-consume pattern. Safety stock provides protection against uncertainty. Reorder point, often ROP, identifies the replenishment trigger. Economic order quantity, or EOQ, is a model for balancing ordering and holding costs under stated assumptions.
They can work together, but one cannot replace another. A large order quantity may leave the same late-order problem if the trigger is too low. A higher trigger may reduce shortage exposure while creating more inventory. Kanban sizing answers the narrower question of authorizations in a chosen replenishment loop.
Declare the trigger and its inventory position
For this fictional continuous-review example, expected consumption is 25 units per working day and planned replenishment lead time is four working days. Expected demand during that lead time is 100 units. Choosing 20 safety units sets a reorder point of 120 units.
The trigger applies to inventory position: usable on-hand stock plus usable scheduled supply, minus the demand commitments or backorders included by the stated policy. Do not place another identical order simply because on-hand stock is low while a valid replacement is already on its way. Define reserved and held stock consistently.
Illustrative inputs: 25 units/working day × 4 working days + 20 units = 120 units. This does not specify the order quantity.
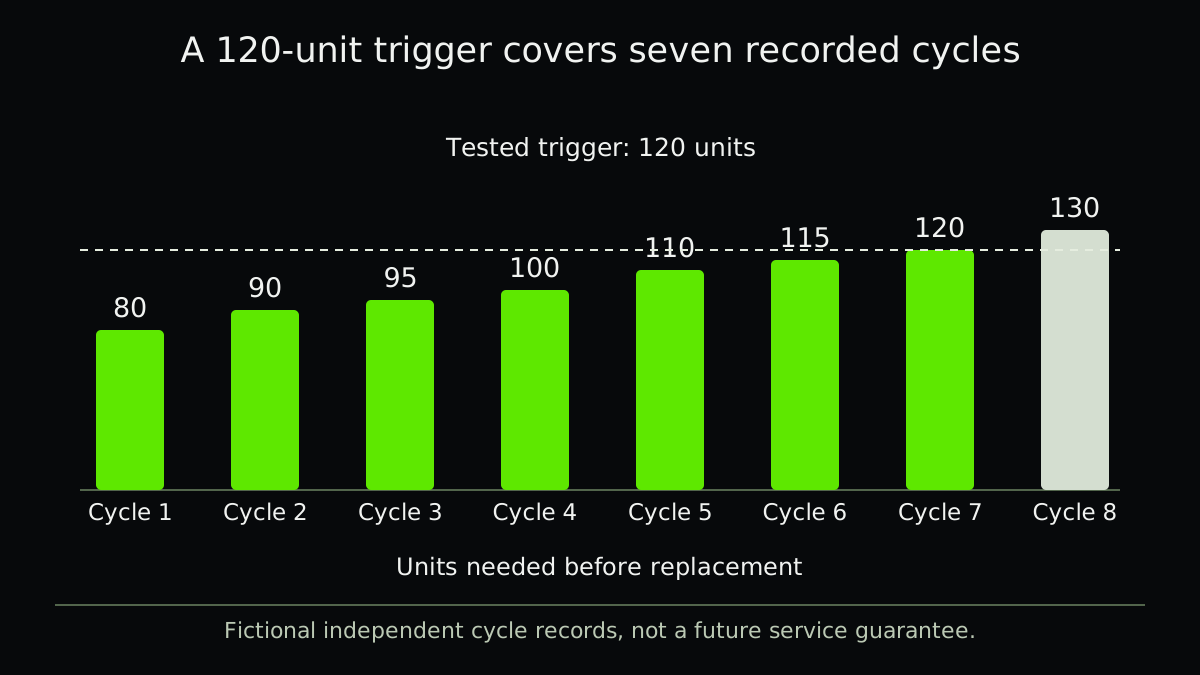
Eight cycles show the difference between coverage and a guarantee
Suppose eight separate fictional replenishment cycles need 80, 90, 95, 100, 110, 115, 120 and 130 units before replacement becomes usable. Assume each begins at the tested trigger with no further usable supply during its cycle. A 120-unit trigger covers seven of the eight demands; the last cycle is 10 units short.
That is an 87.5% no-shortage share in this tiny teaching record, not a forecast of future cycle service. Raising the trigger to 130 covers all eight recorded cycles but does not prove a 100% future service level. Fill rate, which concerns the share of demand supplied, is a different measure.
| Fictional cycle | Demand before usable replacement | Covered by 120 units? |
|---|---|---|
| 1 | 80 | Yes |
| 2 | 90 | Yes |
| 3 | 95 | Yes |
| 4 | 100 | Yes |
| 5 | 110 | Yes |
| 6 | 115 | Yes |
| 7 | 120 | Yes |
| 8 | 130 | No, short by 10 |
Use a statistical model only when its assumptions fit
A statistical safety-stock model needs a defined service measure, demand behavior, lead-time behavior and treatment of dependence. Independent daily demand with fixed lead time is a different problem from intermittent demand and variable supplier delay. Do not combine a service factor with a second hidden percentage allowance.
ASCM’s inventory-range discussion distinguishes safety, cycle and other stock. Keep inspection-held, obsolete and transport inventory visible rather than hiding everything inside the safety allowance. For a critical spare, the consequence and recovery decision may be more important than average daily consumption; use the spares guide for that task.
A SAP calculation is tied to its product and settings
SAP ERP’s documented safety-stock and reorder-level calculation uses the stated service level and forecast accuracy. SAP S/4HANA learning material also distinguishes requirements-based and consumption-based planning. Those references do not establish one formula or screen sequence for every SAP product.
Check the actual material, plant or planning-area settings, lead-time definition, stock status and planning procedure before comparing a system value with a spreadsheet. Keep the documentation version with the result. A manual override should retain its reason and review, not silently become an assumed statistical buffer.
Trial a change without losing the shortage record
Choose a representative part and observation window with the people responsible for planning, stores and customer service. Keep receipts and open shortages in the record. Reducing the stock ledger while expediting every order does not establish an improvement.
- Define the policy
Name the trigger position, order quantity, eligible stock and usable-receipt event.
- Check the inputs
Retain demand during actual replenishment, not only a monthly average.
- Choose protection deliberately
State the service measure, shortage consequence and buffer assumptions.
- Compare the complete result
Review shortages, inventory, expedite effort, quality holds and delivery before keeping the change.
A related example from Abolfazl
Compare an order triggered by inventory position with an order placed on a fixed review day.
In English, on founder Abolfazl’s personal blog. This is related reading, not an independent technical source.
Practical checklist
- Name the part and replenishment boundary.
- Separate cycle, safety, held and obsolete stock.
- Define inventory position and avoid duplicate orders.
- Use matching demand and lead-time units.
- State the service measure and shortage consequence.
- Keep actual lead-time demand and open shortages.
- Test supplier delays, minimum lots and exceptional demand.
- Review stock, service, expediting and quality together.
FAQ
FAQ
Sources and further reading
Authoritative references used to research and verify this guide.