
 Abosh
Gage R&R estimates measurement variation from repeatability and reproducibility under a defined study design. Repeatability concerns repeated measurement under the same conditions; reproducibility concerns changes such as operators. Compare the combined variation with the question you need to answer, using study variation or tolerance consistently. R&R alone does not establish accuracy, bias, linearity or long-term stability. Choose representative parts and conditions, then investigate the largest supported source of variation.
Design a repeatable study rather than measure one convenient part.
Distinguish percent study variation from percent tolerance.
Keep calibration, bias and R&R as separate checks.
Ten parts, three operators and two trials in millimetres. A separate teaching dataset.
ExcelDownload the Excel worksheetEditable fields and the article’s worked example, with clear units and checks. Open in Excel or another spreadsheet app.
The reading includes the measuring process
If two operators report different diameters on the same shaft, the production process has not changed between those readings. The difference might come from contact position, force, fixture, temperature or instrument resolution.
NIST’s gauge-study guidance treats repeatability, reproducibility, stability, bias, linearity and resolution as distinct concerns. A calibration certificate does not quantify every source of variation during ordinary use.
This guide helps plan and interpret a study. Use Cp and Cpk only after you understand how measurement variation affects the capability inputs.
Choose parts and operators that represent the job
For a crossed study, the same parts are measured repeatedly by each participating operator. Keep part identity, randomize the measurement order and conceal earlier readings where practical. Use the routine method, not a specially careful demonstration that will never occur during a shift.
Select parts spanning the variation relevant to the decision, trained operators and the actual fixtures or instruments in scope. NIST emphasizes representative study choices. A common starting layout is ten parts, three operators and two trials, giving 60 readings; it is an example design, not a universal qualification requirement.
Destructive tests cannot repeatedly measure the identical part. They need a justified nested or alternative design and suitable assumptions about comparable samples. Do not force such data into a crossed analysis.
Two percentages can tell different stories
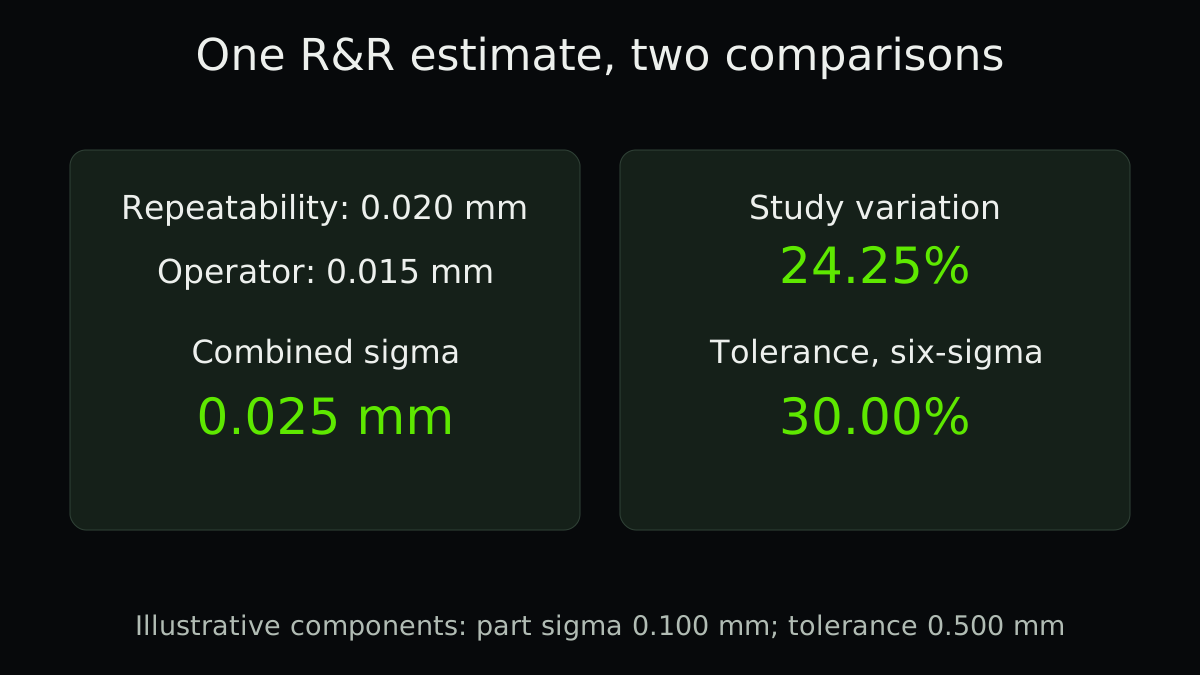
Illustrative calculation: assume an appropriate study has estimated repeatability σ = 0.020 mm, an operator component σ = 0.015 mm and part-to-part σ = 0.100 mm. These are fictional component estimates, not results derived from a supplied raw study. Assume independent components and no additional interaction component for this calculation.
Combined R&R is sqrt(0.020² + 0.015²) = 0.025 mm. Total study sigma is sqrt(0.025² + 0.100²), approximately 0.1031 mm. The R&R share of study variation is 100 × 0.025 / 0.1031 = 24.25%.
For a 0.500 mm tolerance width and an explicitly chosen six-sigma convention, percent tolerance is 100 × 6 × 0.025 / 0.500 = 30%. The two percentages use different denominators. Neither is the percentage of parts measured incorrectly.
| Measure | Calculation | Result |
|---|---|---|
| Combined R&R sigma | sqrt(0.020² + 0.015²) | 0.025 mm |
| Percent study variation | 100 × 0.025 / 0.1031 | 24.25% |
| Percent tolerance, six-sigma convention | 100 × 6 × 0.025 / 0.500 | 30.00% |
Prepare a crossed Gage R&R record
Download a blank 60-reading collection plan: ten parts, three operators, two trials. This teaching design is not a required sample size. Adapt it to the measurement decision before collecting data.
The plan randomizes part order within operator and trial. Finish all operators in trial one before trial two. Conceal previous readings, retain units and timestamps, and do not reuse a changed or destroyed part as an unchanged repeat. Use suitable crossed ANOVA software to estimate components and inspect interaction; this form does not estimate R&R.
Calculations stay in your browser. Inputs are not saved after leaving this page. Download the record if you need to keep it.
Collect readings before estimating variation
Use one row for each actual reading, retaining part, operator, trial, unit and time. Select parts that represent the variation relevant to the decision, not ten convenient adjacent pieces. Keep setup, instrument and environmental conditions with the study.
Download the blank collection plan as CSV and open it in a spreadsheet app. It contains no measurements. The earlier 0.020, 0.015 and 0.100 mm values are separate fictional estimates, not results from this blank plan. A crossed ANOVA also needs a decision about interaction and negative component estimates.
Work through a crossed study from 60 readings
This separate fictional dataset has three operators measuring the same ten parts twice each. All 60 readings are in millimetres. It does not supply the earlier example’s assumed sigma components, and the existing supplied-component calculator remains a different exercise.
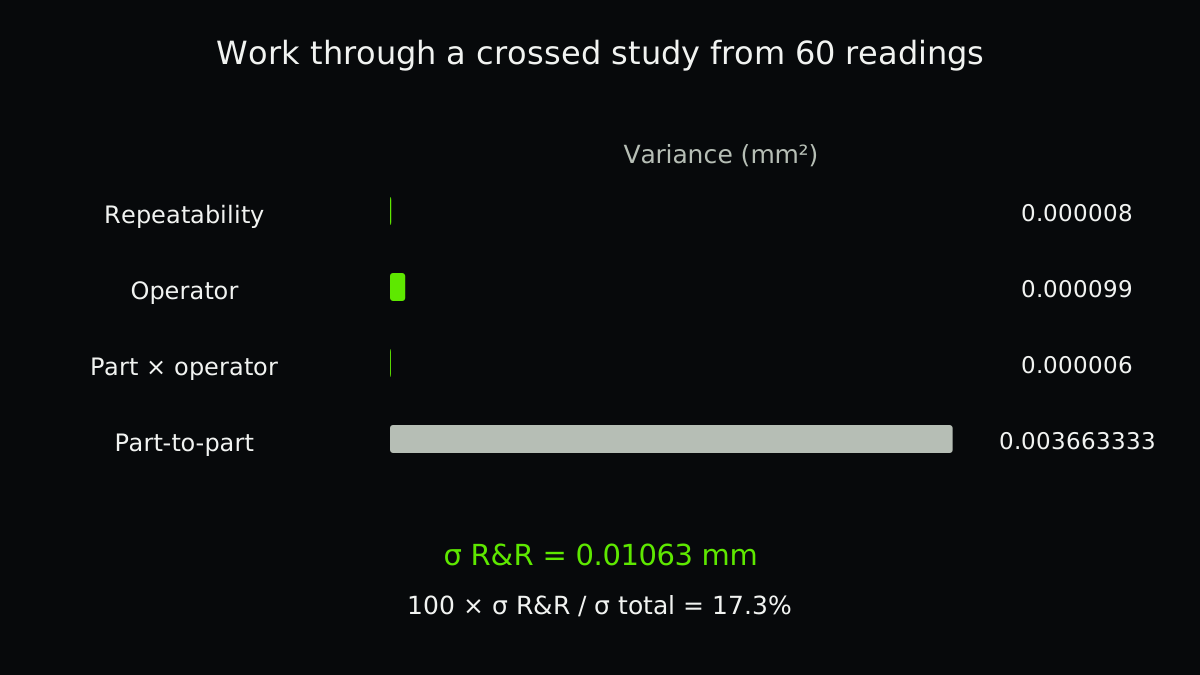
The download uses a crossed analysis of variance, or ANOVA, with part-by-operator interaction retained. It does not test the interaction and then pool it into error. The worked sums of squares are 0.198 for parts, 0.004 for operators, 0.00036 for interaction and 0.00024 for repeatability. Divide by 9, 2, 18 and 30 degrees of freedom to obtain mean squares of 0.022, 0.002, 0.00002 and 0.000008 mm².
Variance and standard deviation use different units. Adding repeatability, operator and interaction variance gives 0.000113 mm² for total R&R. Its square root is 0.010630 mm; total study standard deviation, including parts, is 0.061452 mm.
R&R is 17.30% of study standard deviation but 2.99% of total variance. Neither number is a defect rate. The calculated number of distinct categories, ndc, is 8. These results do not release a gauge or accept a part. Study design, the intended decision and the applicable requirements still matter.
Raw negative component estimates remain visible. For reported components, totals and square roots, the model uses zero instead of a negative variance; this dataset has none. Missing, duplicate, non-finite or unbalanced readings cause an error. A destructive or unbalanced study needs a different justified analysis.
The workbook contains the 60 readings and reviewed analysis results. The results table is a fixed reference, not an automatic ANOVA calculation. Check the study layout, units, interaction policy and treatment of negative estimates before using a result. The deliberately constructed teaching data do not validate independence, normality, representative sampling or long-term stability.
| Component | Variance (mm²) | Standard deviation (mm) |
|---|---|---|
| Repeatability | 0.000008 | 0.002828 |
| Operator | 0.000099 | 0.009950 |
| Part × operator | 0.000006 | 0.002449 |
| Part-to-part | 0.003663333333 | 0.060525 |
| Total R&R | 0.000113 | 0.010630 |
Keep interaction and time effects visible
A crossed analysis may find that an operator measures some parts differently from others. That operator-by-part interaction should not disappear inside a simplified calculation. Use a method appropriate to the study and review its assumptions with a qualified analyst.
A short repeated-measurement study may miss drift over days or months. NIST provides separate time-related study designs. Check the duration relevant to production, including warm-up, shifts and environmental changes.
- Define the use
Decide whether the measurement supports sorting parts, studying variation or both. Record the characteristic, unit and tolerance.
- Plan the study
Choose parts, operators, gauges, trials and randomization. Identify whether the same part can be measured again.
- Retain individual readings
Store part, operator, trial, time, configuration and method version. Do not replace records with only averages.
- Analyze and improve
Estimate relevant components, examine interaction and decide what to change using the applicable acceptance criteria. Repeat under comparable conditions.
Treat thresholds as requirements, not slogans
A customer may prescribe a method and acceptance threshold. The consequence of a wrong decision also matters: sorting near a safety-critical tolerance boundary is different from monitoring a wide-spread process.
Do not quote 10% or 30% without naming the denominator, convention and applicable agreement. A single R&R percentage cannot establish whether the instrument is fit for every product family.
Before blaming the operator, inspect fixtures, work instructions, contact locations and ergonomics. Root-cause analysis is useful here because the apparent symptom may have several explanations.
Protect analytics from changing measurement methods
When a gauge, fixture or inspection method changes, retain its version in the quality record. A jump in measured variation may be a measurement change rather than worse manufacturing.
Separate unknown or invalid readings from genuine rejects. An automated quality model trained on mixed methods can learn the measuring system instead of the product.
A related example from Abolfazl
Inspect a repeated-measurement example before blaming the machining process.
In English, on founder Abolfazl’s personal blog. This is related reading, not an independent technical source.
Practical checklist
- State the characteristic, units and measurement decision.
- Select representative parts and trained operators.
- Choose crossed or nested design appropriately.
- Randomize trials and retain individual records.
- Check resolution, calibration and bias separately.
- Evaluate interaction and relevant time effects.
- Label every percentage with its denominator and convention.
- Repeat the study after a documented improvement.
FAQ
FAQ
Sources and further reading
Authoritative references used to research and verify this guide.